Globe and layers
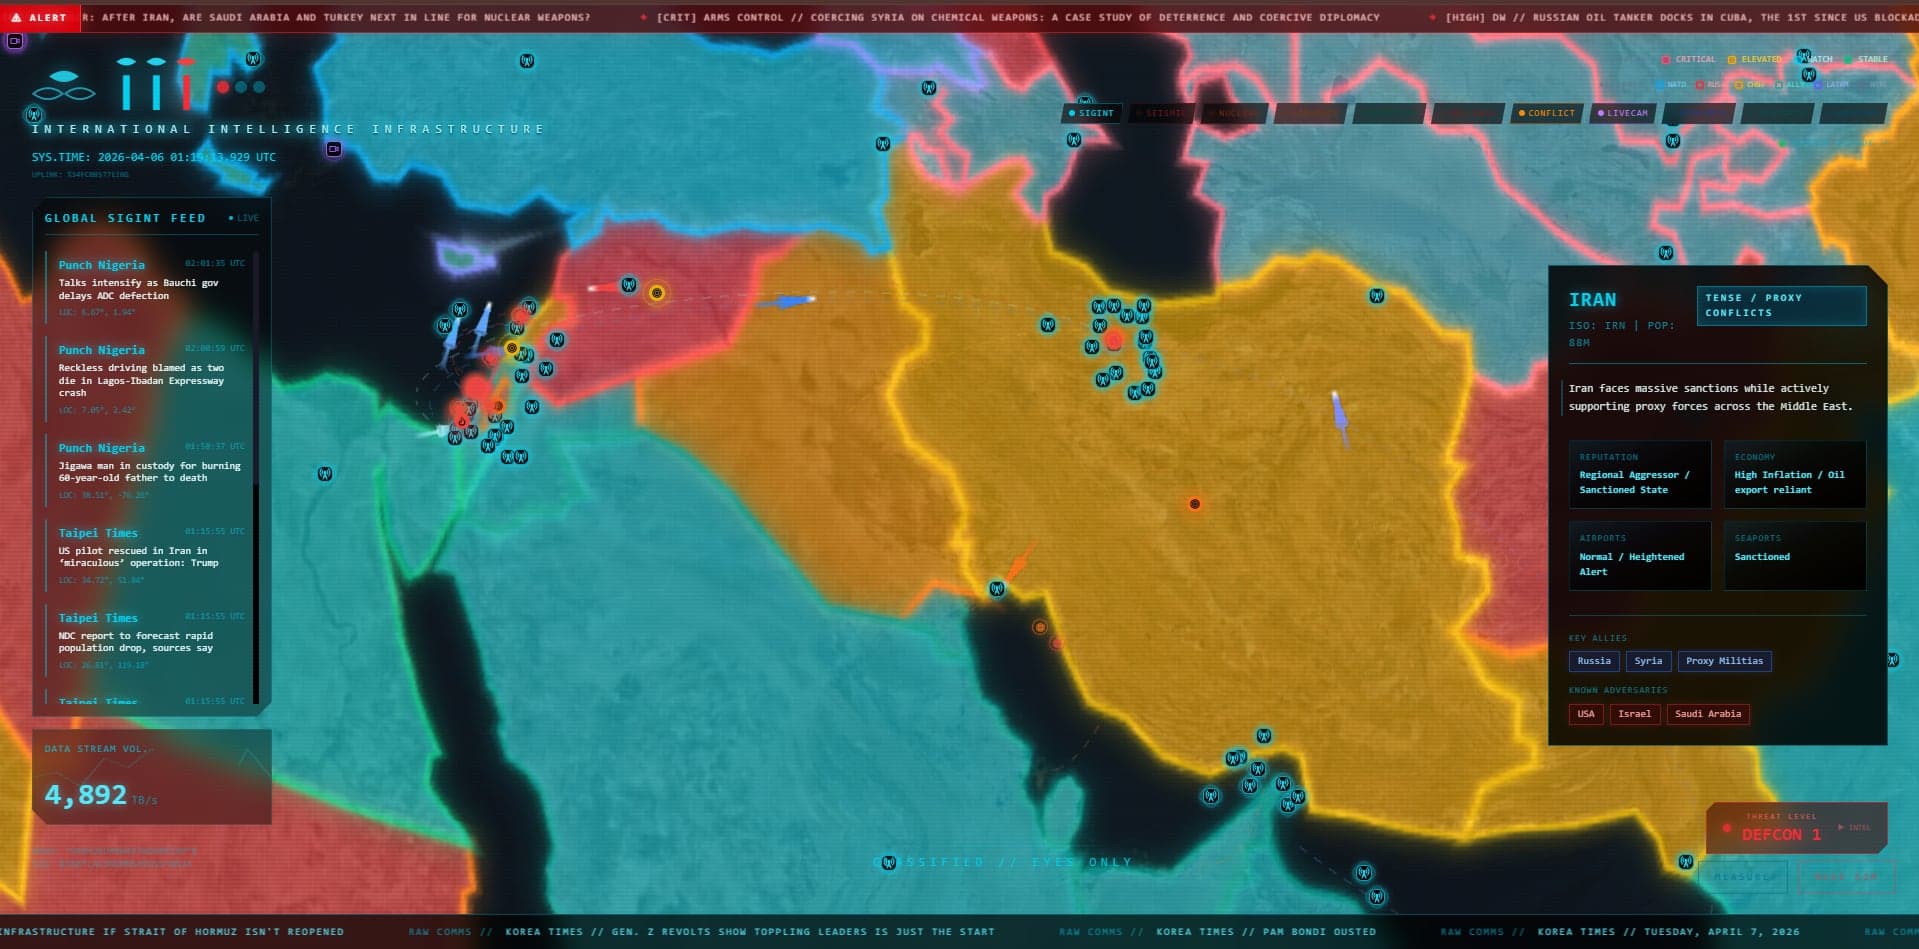
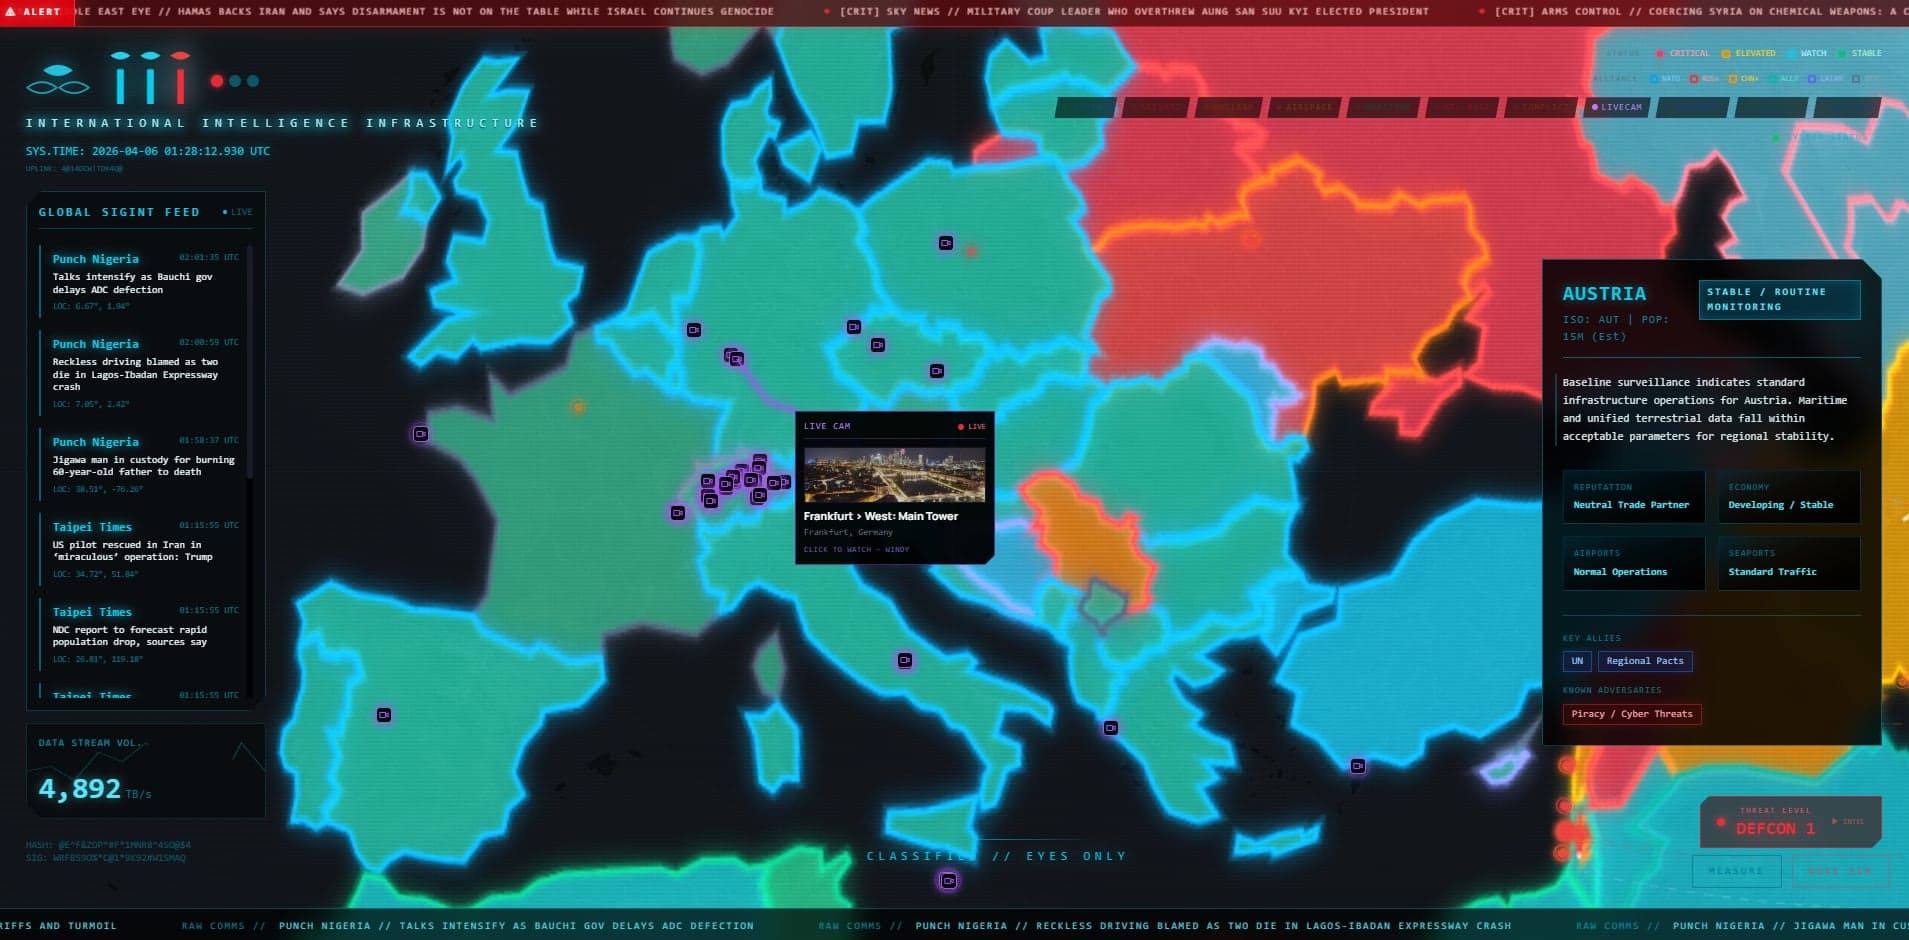
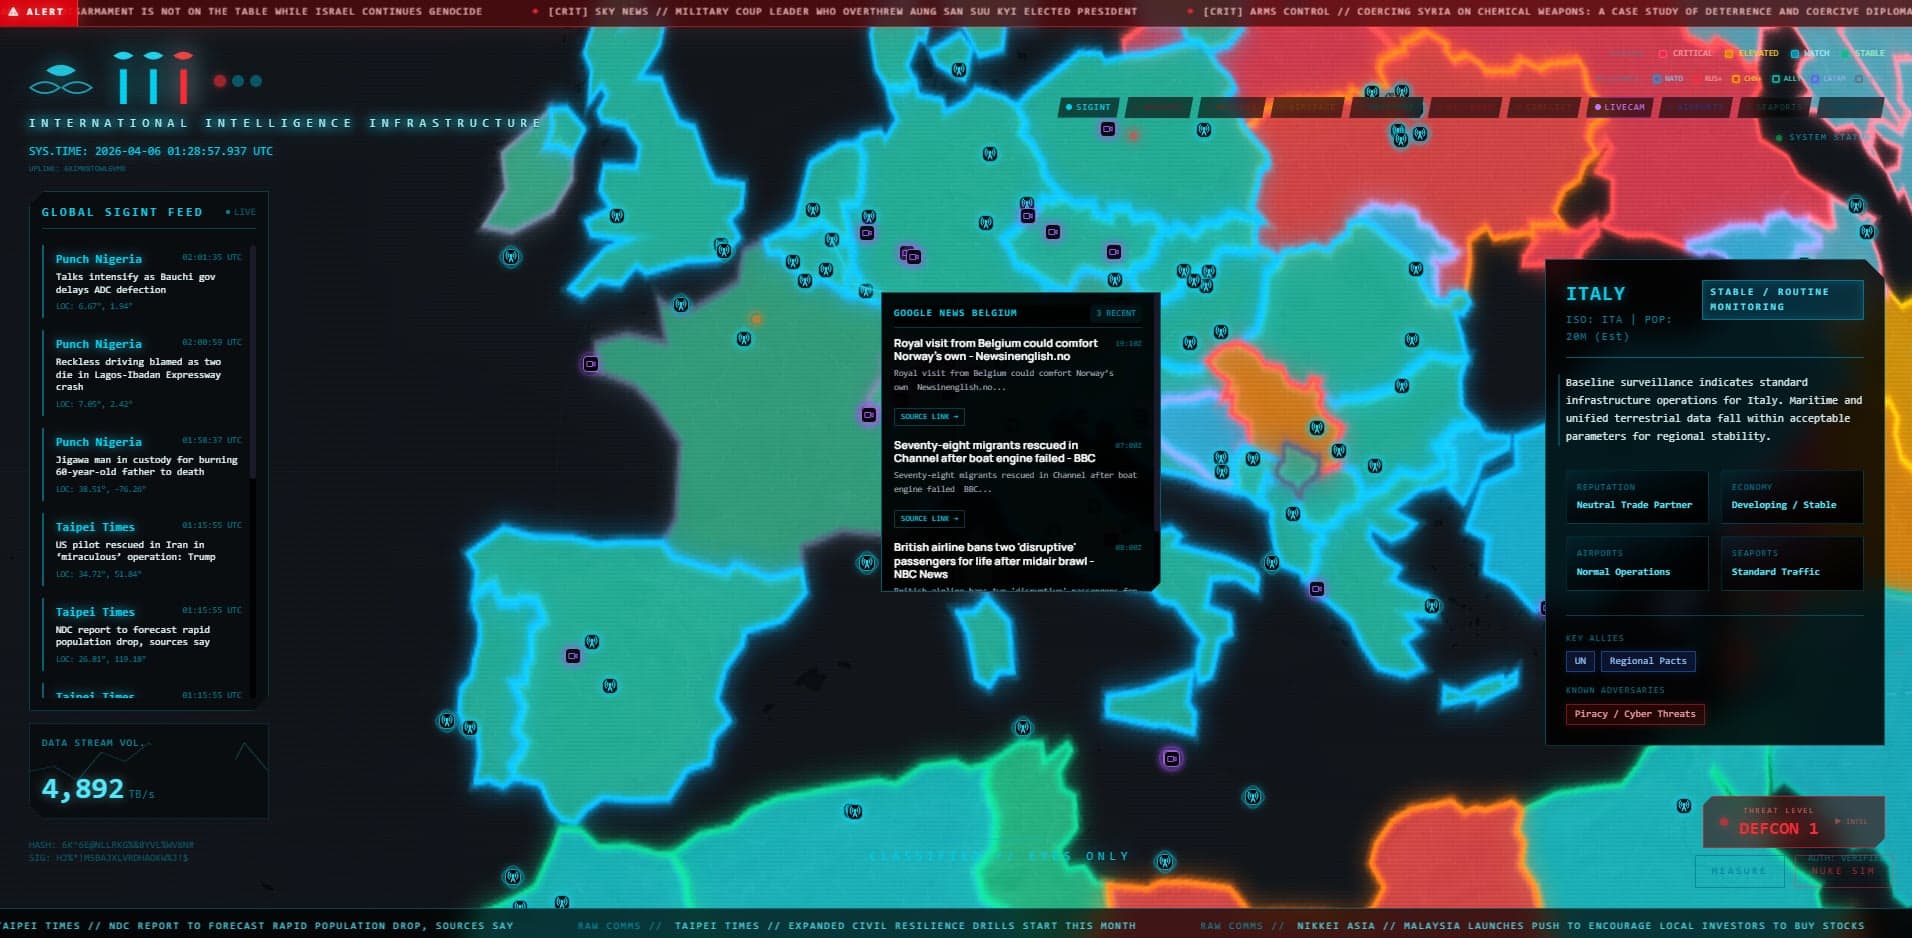
CesiumJS renders the globe. Each layer can be toggled, and marker cards show the detail behind a point without leaving the view.

 Contact ↗
III is my interactive 3D globe for exploring live geographic data: earthquakes, aircraft, ships, conflicts, military bases, nuclear facilities, airports, seaports, news, webcams and weather, in a HUD-style interface. Live at iii.lewks.world.
Interface design · 3D globe integration · Data providers and API routes
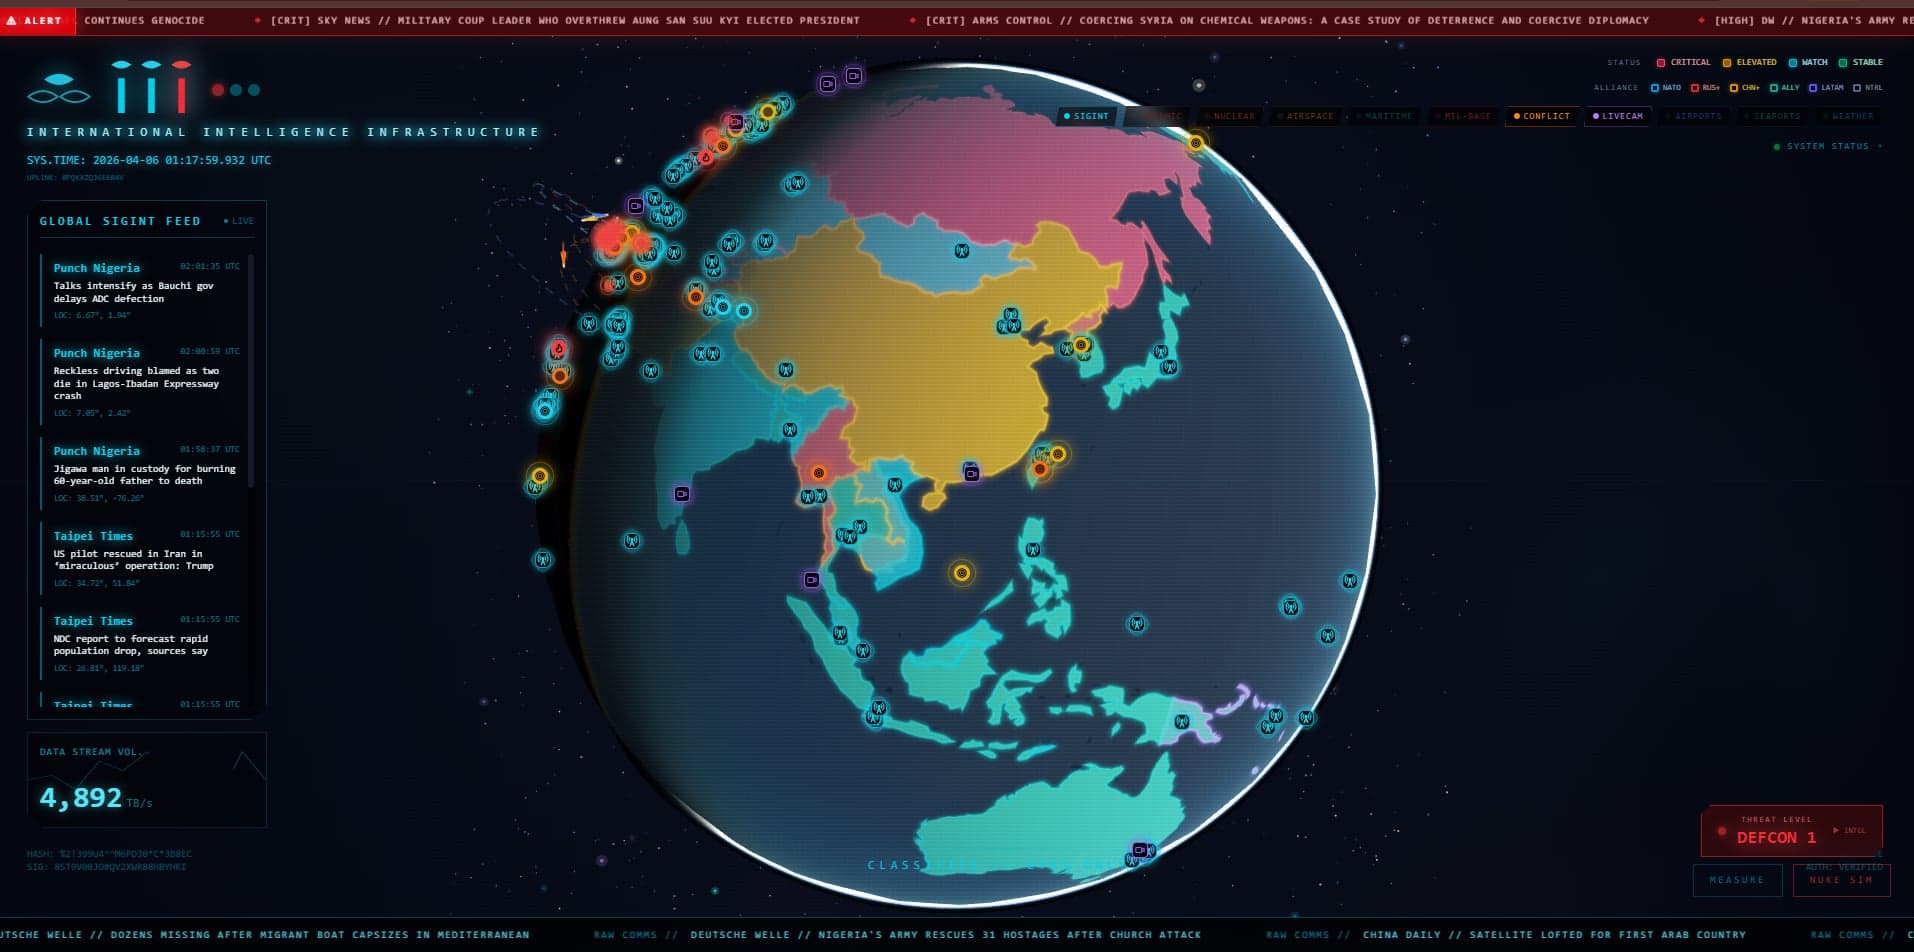
Many information layers compete for attention. The challenge was to let visitors explore them geographically while keeping the underlying details accessible, and to keep the page responsive when a live feed is slow or down.
CesiumJS renders the globe. Each layer can be toggled, and marker cards show the detail behind a point without leaving the view.
Provider modules pull USGS earthquakes, OpenSky aircraft positions, AIS ship data, RSS news and alerts, Windy and YouTube webcams and weather, cached with timeouts so a slow feed never blocks the page.
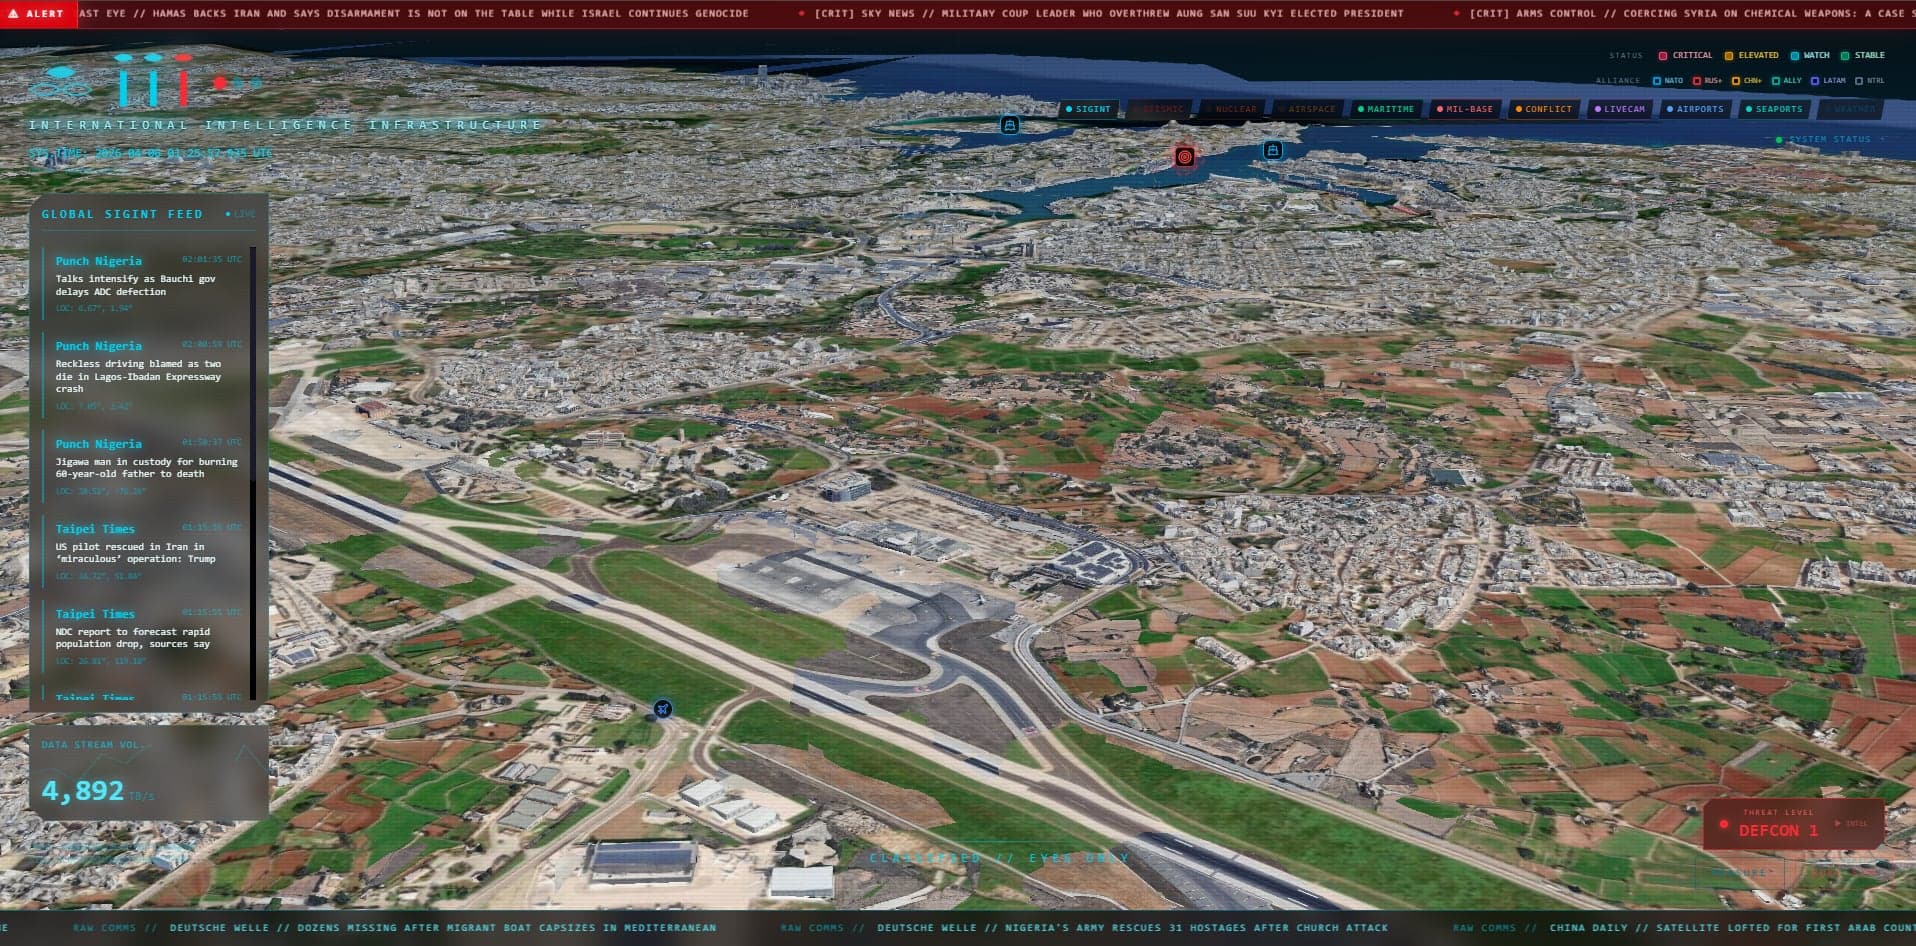
Conflict zones, military bases, nuclear facilities, airports, seaports and country profiles are curated datasets with threat-level colouring.
USGS feed with magnitude, depth and time.
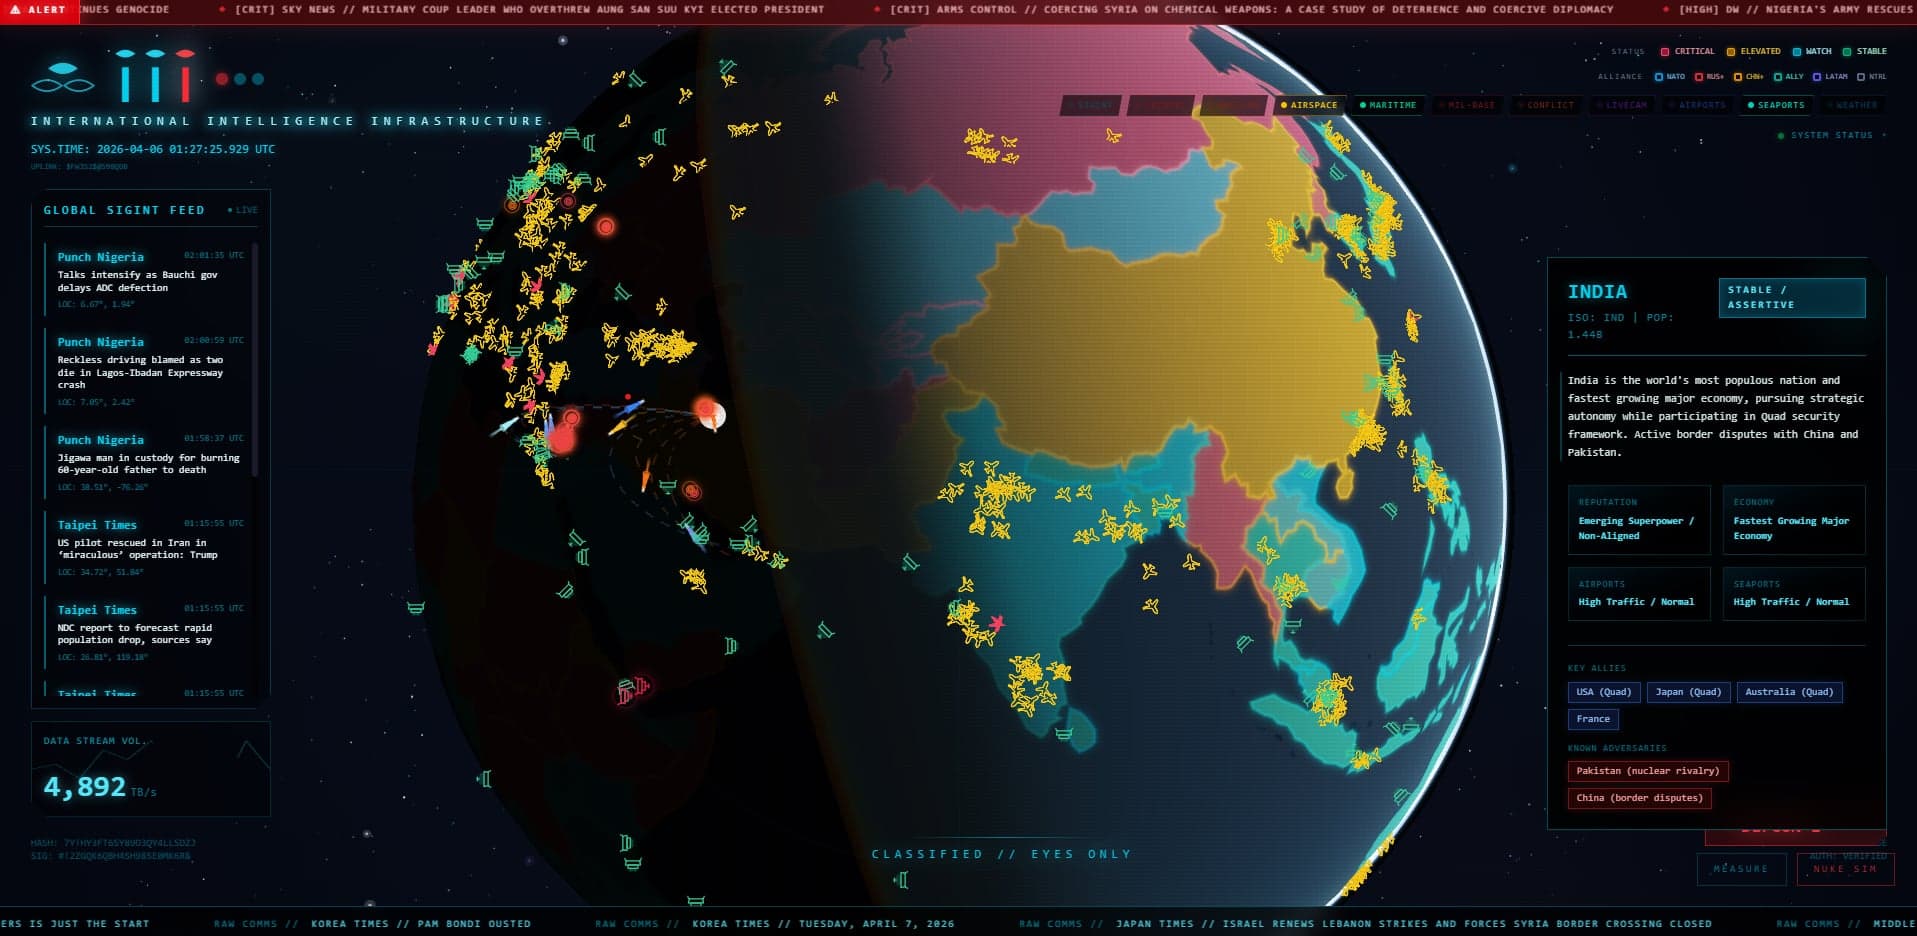
ADS-B positions from OpenSky and AIS vessel data.
Conflict zones, military bases and nuclear facilities.
Airports and seaports with status and specifications.
RSS feeds from many regions, translated where needed.
Windy and YouTube webcams, and weather at major cities.
An exploratory interface combining 3D interaction with multiple live and curated data sources. Feed availability and freshness depend on their individual providers.
Tell me what you need built or improved.